 Sign In
 0 Items (
 Search


“Are We Feeling Warmer Yet”, a paper published in November 2009, pointed to the official NZ Met Office temperature records as showing that New Zealand experienced no warming during the twentieth century. Yet the NIWA “Seven-station Series” (SSS) – affected by numerous undisclosed adjustments – claimed a warming trend of approximately 1.0°C during the same period.
See "Crisis in New Zealand Climatology" for further details.
To respond to this paper, NIWA brought in Dr Jim Salinger as a consultant (despite the fact that he had been summarily dismissed for serious misconduct only seven months earlier). Within days, a story appeared in the NZ Herald with the lead-in:
“The state-owned atmospheric and water research institute has taken the unusual step of publishing a graph of raw climate data on its website to answer critics who accused it of fiddling the figures.”
This graph is introduced with the sentence: “We have identified from the NIWA climate archive a set of eleven stations spanning New Zealand in which there has been no significant site moves for many decades”. The emphasis on “eleven” is reflected in NIWA’s title for the dataset – “The Eleven-Station Series” (ESS). On the website, it appears as:
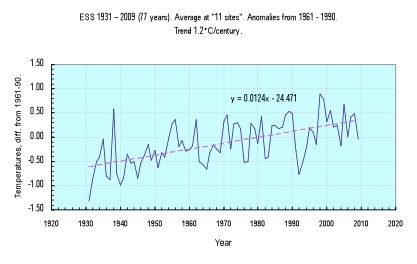
The web page states: “The warming trend over the 77-year period is 1°C”. This equates to a rate of 1.2°C per century’.
Unlike the SSS, NIWA did not initially offer any spreadsheet showing the data behind the ESS graph, but this was produced on 24 May in response to a Parliamentary question. On that same day, the following Q & A appear in the record:
# 08810 (2010)
Question: Can the Minister confirm that the NIWA ’11-station’ contains only four stations during its period of most rapid warming, and that it did not acquire 11 stations until 1948?
Answer: The spreadsheet that I referred to, in my answer to Question 08809, shows the number of stations contributing to the mean temperature anomaly for each year.
The number varies with the opening and closing of stations and with missing data; 3 stations operated in 1931, 4 during the period 1932–1937, between 5 and 9 during the period 1938–1944; with the exception of 1964 (8 stations) there were between 9 and 11 stations operating in 1945 and all subsequent years.
So much for the “eleven-station” misnomer. This graph does not represent “a set of eleven stations spanning New Zealand” – not in 1931, or 1941, or even 1951!
A perusal of the spreadsheet shows that the “eleven-station” temperature series did not actually commence until 1955. And it terminated in 1994, with the permanent closure of the Molesworth station.
What NIWA called a 77-year period is in fact a 40-year period, and the graph of that period appears as:
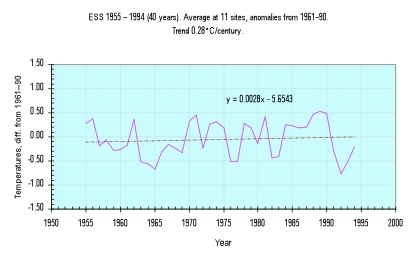
The genuine ESS graph has a very different shape from that of the impostor on the NIWA website. It is boring. One can see at a glance that the overall warming/cooling trend is close to zero. In fact, the warming trend rate is 0.28°C per century.
The ESS fails dismally to meet NIWA’s stated objective – “to answer critics who accused it of fiddling the figures”. There is nothing here to confirm the 1.0°C per century warming trend claimed in the SSS.
On the contrary, if the ESS accurately represents average temperatures for all of New Zealand – as NIWA claims – then its boring curve casts further doubt on the spectacular warming claims of the SSS.
The “Variable-station Series” (VSS)
NIWA’s tack-on to the front-end of the ESS does show warming. This comprises 24 years of a constantly-variable number of stations. It is a hotchpotch of temperature averages whose only connection with the ESS is that its varying sites fall within the same chosen universe of stations.
The selected starting-point of 1931 achieves its exceptionally low reading of -1.32°C from just three stations – Queenstown, Palmerston North and Hamilton. Mount Ruapehu briefly joins the collection two years later, but is then removed again until 1938.
By 1944, the North Island has five stations and the larger South Island has two. How could such a mix ever be representative of aggregate New Zealand temperatures?
The graph of the 1931-1954 VSS appears as:
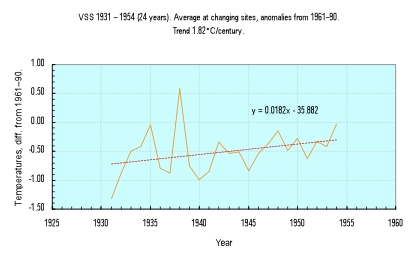
NIWA’s desired trend is rediscovered!
The 1.8° per century warming trend during the 24-year VSS was not created by changes in the New Zealand climate. It was created by adding and subtracting temperature data to achieve a predetermined result.
This particular universe was chosen by Salinger from the 238 stations in the database, and he also chose the time period and methodology details. And his stated purpose was to persuade the public that a 1.0°C/century warming trend was shown by the ESS, in order to corroborate the trend shown in his earlier SSS creation.
It is almost impossible to avoid the conclusion that NIWA’s political urge to prove a warming trend overcame its professional urge to apply objective scientific principles in constructing a sound and defensible temperature series.
Station Selection
There are other serious problems with the ESS. The two mountain weather stations (Ruapehu and Queenstown) are “Class 4” – carrying an error potential as high as 2°C – and are not normally used for climate research.
Despite the website claim that the selection was made because “these sites have never been shifted” the NZCSC has documented relocations in no fewer than six of the stations.
An objective researcher, seeking a group of stay-put stations collectively representing New Zealand-wide temperatures, would not have selected this combination.
Conclusion
Pejorative adjectives are being linked to Government climate scientists with ever-increasing frequency. Words like “fiddled figures” or “manipulation”, or “doctored data”. Wherever these allegations arise, the clumsy NIWA attempt to pass off its VSS as a legitimate limb of its ESS is likely to be raised.
One of the worst aspects of the ESS is that it was published to dispel prior allegations of chicanery. Its very purpose was damage control. The Minister (Hon Wayne Mapp) tabled it in Parliament as evidence that allegations of bias against NIWA were baseless. It has been presented as a testament to NIWA’s honesty and professionalism.
Instead, it compounds the original offence.
NIWA scientists are accountable to superiors. The Crown Company has an ‘independent’ board and chairman, appointed for their acumen and integrity, and they are politically responsible to a Minister. These people cannot indefinitely stand aloof as the unscientific machinations of their subordinates become public knowledge, and eat away any remaining trust in their Institute.
