 Sign In
 0 Items (
 Search


A CSIRO report, “The Effect of Climate Change on Extreme Sea Levels in Port Phillip Bay”, prepared for the Victorian Department of Sustainability and Environment forecasts 1 metre sea level rises over this century. This is a near doubling of the IPCC forecast extreme of 59 cm.
A direct measurement suggests that the effect of increasing temperatures has been overestimated by a factor of 4.
The measured increase in world sea levels from 1993 to 2003 is 3.1 mm per year. In the IPCC reports, half of this rise, 1.6 mm per year, is attributed to the thermal expansion of the oceans while the balance comes from melting ice caps, ice sheets and glaciers.
The thermal expansion of 1.6 mm per year has been arrived at by elaborate computer modelling of the oceans to a depth of 700 metres or more.
So according to the IPCC over 10 years from 1993 to 2003 the sea level has risen by 16 mm due to thermal expansion. This is an indirect measure. So is there a direct measure that can be made?
For some 20 years the University of Colorado has provided satellite measurements of changes in sea level through all the oceans on earth. The global increases are provided with and without pressure corrections and the pressure corrected measurements are shown in Figure 1:
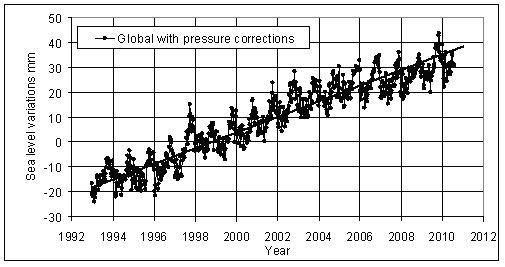
Figure 1: Global sea level variation in mm after pressure corrections. There is an average increase in sea level of 3.1 mm per year from 1993 to 2010.
The seasonal variation in sea level is due to temperature and pressure changes. The pressure variation must be removed to expose the variations due to changing temperatures. Extreme examples of this pressure effect are seen in hurricanes when the pressure drops by 100 millibars the sea level increases by a metre. A direct measure of the thermal expansion requires a matching set of sea surface seasonal temperature measurements. Fortunately, the Hadley Centre provides exactly this in monthly data sets on their website.
All this data is available for any user, a splendid example of “the commons” in internet information. The resulting sea level variations, in Figure 2, show a quite regular behaviour. The global variations in the surface temperature of the ocean also show a quite regular behaviour with changes in temperature leading sea level changes by about two months.
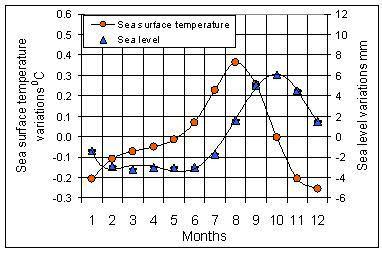
Figure 2: Global seasonal sea level with pressure correction and sea surface temperature variations.
The changes in sea level and temperature allow the direct calculation of the expansion of the ocean from sea surface temperature changes. A sea surface temperature change of 0.62 0C is driving a sea level change of 9 mm giving a sea level rise of 15 mm per 0C.
There are other ways of using the sea level measurements to get a measure of sea level rise. Most importantly they provide a check on the global value. Variations of sea levels during El Ninos and regional variations outside the Tropics both support the global value.
The IPCC does not give the sea level rise with temperature increase but rather the annual sea level rise of 1.6 mm per year. This value is given for the period 1993 to 2003. So for comparison the direct thermal expansion measurement needs the change in the sea surface temperature from 1993 to 2003. Again, turning for measurements to a National Oceanicic and Atmospheric website gives an increase of 0.26 0C from 1993 to 2003.
Over 10 years from 1993 to 2003 the sea level rise due to thermal expansion is 4 mm from a direct measurement and 16 mm from the computer modelling studies of the IPCC reports.
These values are in clear disagreement, the former a direct measure of surface variations and the latter computer modelling of the deeper ocean. There must be some doubt about the forecasts of rising sea levels and indeed given a measured overall increase of 3.1 mm per year, the unexplained balance of 2.7 mm per year sea level rise.
For a global temperature rise of 6 0C at the extreme of the IPCC projections, a good defence against the rising sea of 9 cm would be a good pair of gumboots or platform shoes. However the thermal expansion with the rising sea level is only a part of the story. A continuation of the trend of the last 20 years would give seas rising 30 cm this century. This is along way from the CSIRO projections.
The use of elaborate computer models to indirectly calculate sea level changes is an approach to be found in other climate change areas. At least in this case it is possible to check the estimates with direct measurements.
This raises serious concerns that policymakers and regulators have adopted projections from the CS IRO assuming the certainty of the results. They have not been aware of, or have chosen not to examine the uncertainty of projections.
