 Sign In
 0 Items (
 Search


Thousands of research papers are summarised by the IPCC’s WG1 into 14 chapters of about 100 pages each, which are further summarised into a 70-page technical report that is finally condensed into a Summary for Policymakers (SPM).
Recognising that even a 20-page SPM exceeds the attention span of most journalists, governments distil the politically-relevant essence down to a single soundbite – a meme which becomes the cultural motif of the entire report.
Here are the last three IPCC memes:
2001 TAR: “Most of the observed warming over the last 50 years is likely to have been due to the increase in greenhouse gas concentrations”.
2007 4AR: “Most of the observed increase in global average temperatures since the mid-20th century is very likely due to the observed increase in anthropogenic greenhouse gas concentrations.”
2013 5AR (leaked draft): “It is extremely likely that human influence on climate caused more than half of the observed increase in global average surface temperature from 1951 to 2010.”
The elephant in the room is that this metronomic ramping-up of asserted certainty takes no account of the global temperature standstill which has dominated the data since the mid-1990s. The IPCC has relied on its CIMP5 array of models, without a hint of curiosity as to why they have been so wrong for so long.
Hans von Storch[1] offers five possible explanations for the delinquency of the models:
(1) an underestimation of the natural climate variability;
(2) the climate sensitivity of models may be too large;
(3) there is a missing component in the CMIP5 simulations (eg solar activity)
(4) The last 15 years may have been an outlier.
(5) GHGs play a minor or no noteworthy role in ongoing and expected future climate change.
Warmist von Storch dismisses (5) as being contrary to basic physics. His recent paper[2] finds that the likelihood of (4) is vanishingly small Poimnt (3) refers to natural forcings, which for our purposes can combine with natural variance in (1) as a ‘natural cause’.
Sensitivity
Overestimation of climate sensitivity is almost certainly part of the explanation, with numerous recent papers[3] showing that it needs to be reduced by at least 30%. But sensitivity would need to be close to zero, as in (5) above, to account for the entire standstill.
If that low sensitivity were established, the meme would be: “It is very unlikely that the observed increase in anthropogenic greenhouse gas concentrations had any material effect on the observed increase in global average surface temperature from 1951 to 2013.”
This would not apply if sensitivity is close to 2°C. In round figures, assuming sensitivity of 3°C, the IPCC estimates that each 1ppm of CO2 will add about 0.1°C (at current saturation levels). As CO2 has accumulated at 2ppm/decade, temperatures should have risen by about 0.3°C during the last 15 years. So a reduction of 30% would still leave 0.2°C of “missing heat”.
Natural causes
If the IPCC hypothesis is right and 2°C of heat really was created by CO2 radiation, it must have been offset by 2°C of natural cooling.
This produces a different meme: “Most of the observed plateau in global average temperatures since the mid-1990s is very likely due to natural cooling being offset by the presumed heat from the observed increase in anthropogenic greenhouse gas concentrations.”
Offsetting a natural global cooling trend is the very antithesis of climate change. It is climate stabilization. Far from leading to eventual danger through warming, it rescues the globe from the much greater dangers of cooling – perhaps another Little Ice Age.
Ocean heat
Unlike the Australian Climate Commission4], von Storch recognizes that “variations in heat-uptake by the ocean” are instances of natural climate variability. Even if such variances contribute to aggregate global warming or cooling, they cannot be categorized as ‘anthropogenic’.
But Kevin Trenberth’s missing heat, which resides in the ocean depths, is out of the climate equation altogether. This is a legal reality as well as a physical one – the UNFCC definition of “climate change” is limited to effects on “the composition of the global atmosphere”.
At times, even Trenberth recognizes this[5] : “The oceans can at times soak up a lot of heat. Some goes into the deep oceans where it can stay for centuries. But heat absorbed closer to the surface can easily flow back into the air.” It is clear[6] from Levitus et al (1912) that there has been no observed increase in ocean heat content close to the surface.
So, another meme: “It is extremely unlikely that any human influence on observed increases in ocean heat content will contribute to climate change during the 21st century.”
Attribution
Is the IPCC standard meme a reasonable summary of longer periods? Recent research[7] at Washington University reported in Nature magazine broadly agrees with the IPCC, finding that “internal variability accounts for 40% of the observed recent 50-year warming trend.”
However, the paper also finds that the “underlying net anthropogenic warming rate has been steady since 1910 at 0.07-0.08°C/decade, with superimposed AMO-related ups and downs …” If that is correct, then the record could look like this:
Scenario: warming sources (°/decade) for 1962-2012 period
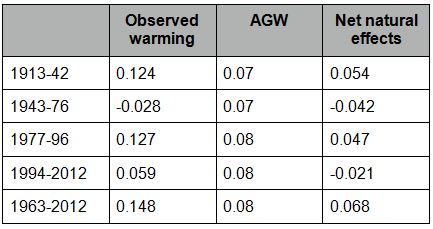
It is immediately evident that the AGW column is a gross figure while the ‘natural’ column is the residual warmth after the values of all the globe’s cooling factors are subtracted. Aggregate gross natural heating sources are probably greater than AGW over all time scales. Until the IPCC attempts to measure natural variances, it is impossible to estimate the percentage contribution of AGW.
So the standard meme should be amended to: “The observed increase in greenhouse gas concentrations over the last 50 years is very unlikely to have contributed to the observed volatility in global temperatures.”
A just-published Nature paper[1] supports this theme, describing a modeling exercise which plausibly showed the 0.68°C warming trend during 1975-98 to be 0.4°C natural and 0.28°C anthropogenic.
From this paper, Dr Judith Curry derives a new meme: “The same natural variability (predominantly PDO/ENSO) that is now causing the standstill was likely the dominant cause of warming in the last quarter of the 20th century.”
Trend of trends
The WMO standard for trend measurement requires a minimum 30 years of continuous data. The 30-year warming trends of the last decade show a steady decline:
HadCRUT4 NOAA RSS
1974-2003 0.197 ±0.057°C 0.185 ±0.055°C —-
1979-2008 0.182 ±0.55°C 0.173 ±0.053°Ç 0.158 ±0.089°C
1983-2013 0.166 ±0.053°C 0.157 ±0.052°C 0.145 ±0.090°C
Since 2003, when the trend reached a peak close to the predicted 0.2°/decade, the trends have been waning strongly. The measured warming trend was lower in 2013 than 2008 which was, in turn, lower than 2003.
Meme: “Temperature trends have been declining steadily during the 21st century, despite the observed increases in greenhouse gas concentrations”.
Decadal
Some commentators believe useful information can be gained by comparing decadal trends. Using RSS figures, the 2004-2013 decade was -0.027 ±0.492°C which is spectacularly cooler than the 0.247 ±0.546°C trend for the preceding 10-year period.
Meme: “The trend of the past decade (2004-13) is very likely the coolest since satellite temperature records began.”
Models
Yet another recent Nature paper[2] has focused on the extraordinary gap between the temperature simulations of 37 CIMP5 models and the observed outcomes. Due to a ‘combination of errors’, the models overestimated warming by 100% over the past 20 years and by 400% over the past 15 years.
Perhaps the most notable feature of this paper is that two of its authors are IPCC lead authors, while the third (Zweirs) is Vice-chair of WG1 for AR5.
Can we expect this meme? “It is very likely that modeled simulations of future human influence on climate are vastly overestimated.”
Over the course of just one month, three authoritative papers accepted by just one publisher (and the von Storch one[3] that Nature rejected) have devastated the IPPC’s proposed meme.
All these papers have appeared after the draft SPM for WG1 was distributed to governments on 2 August 2013. When representatives of those governments gather in Stockholm to approve the SPM, will they adjourn and call for further work? Or will they robotically rubber-stamp the now outdated meme?
[1] Yu Kosaka et al (2013) http://judithcurry.com/2013/08/28/pause-tied-to-equatorial-pacific-surface-cooling/
[2] Fyfe, Gillett and Zwiers (2013): “Overestimated global warming over the past 20 years.”http://www.nature.com/nclimate/journal/v3/n9/full/nclimate1972.html?WT.ec_id=NCLIMATE-201309
[2] http://www.academia.edu/4210419/Can_climate_models_explain_the_recent_stagnation_in_global_warming
Hans von Storch & Eduardo Zorita (2013).
[3] http://bishophill.squarespace.com/blog/2013/7/26/the-lords-do-battle.html
[4] http://climatecommission.gov.au/report/the-earth-continues-warm/#more-37057
[5] http://www.npr.org/2013/08/23/214198814/the-consensus-view-kevin-trenberths-take-on-climate-change
[6] http://wattsupwiththat.com/2013/07/24/reactions-to-the-pause-grasping-at-strawmen-in-hidey-holes/
[7] Tung & Zhou (1913)
